Visualise Your Novel's Pacing and Structure Using MS Excel, OpenOffice or LibreOffice Calc
No matter how often you read and re-read your manuscript, it can be difficult to get a intuitive grasp of your story's overall structure and pacing.
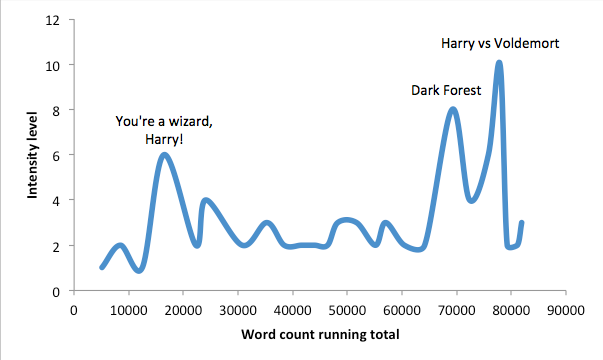
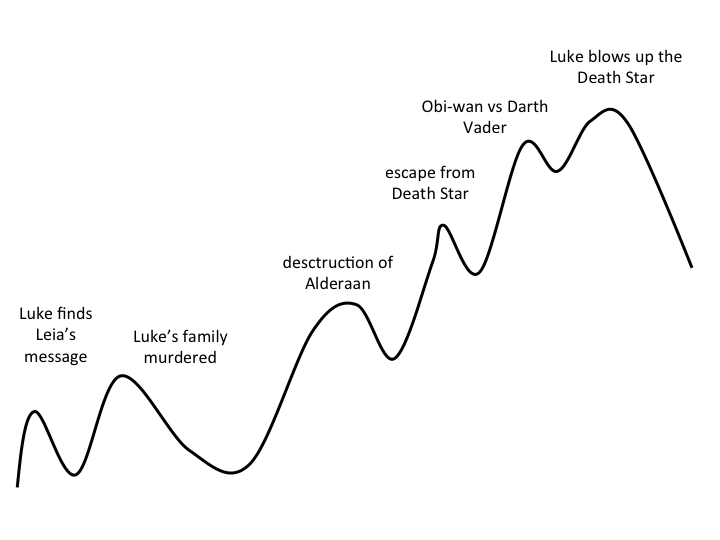
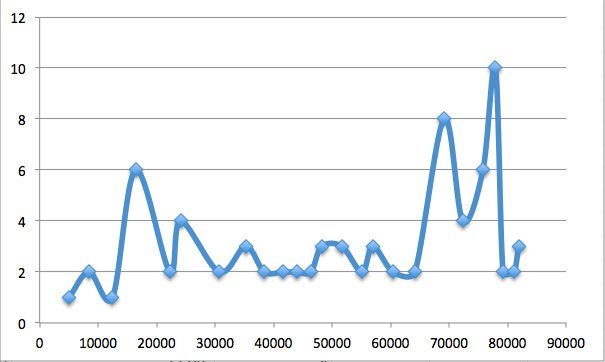
You've probably seen images like the one below for classic novels or movies. Wouldn't you love something like that for your own manuscript? Here's how to make one in a few simple steps. I'll give instructions for MS Excel, OpenOffice Calc and LibreOffice Calc. (As of April 2019, for some strange reason it's not yet possible to produce this simple chart type using GSheets, so don't waste your time trying.)
Step 1: Make a scene list
In a spreadsheet, list all the scenes in your novel, one per line. In the second column, note the word count for each scene.
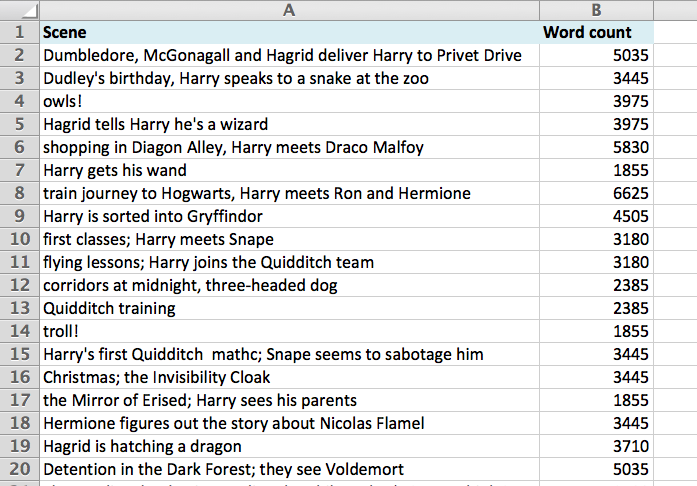
How you define a "scene" will probably depend on the length of your story. Short chunks of texts will be appropriate for a novella, while for a 150k-word fantasy epic you may want to work with chapters instead of scenes.
It can be useful to try this exercise even before you have a completed draft, using estimated word counts for each scene.
Step 2: Add the cumulative word count
In this step, you'll add a third column to your spreadsheet, containing the running total of the word count, also known as the cumulative sum.
The "running total" means the total number of words since the start of the story. For example, if your first three scenes have word counts of 2000, 1500 and 2900 respectively, then the running totals will be: 2000, 3500 and 6400 words.
To calculate the running total, enter the following formula into cell C2 in your spreadsheet.
=SUM($B$2:B2)
For this to work, the word count for your first scene needs to be in cell B2, as in the screenshot.
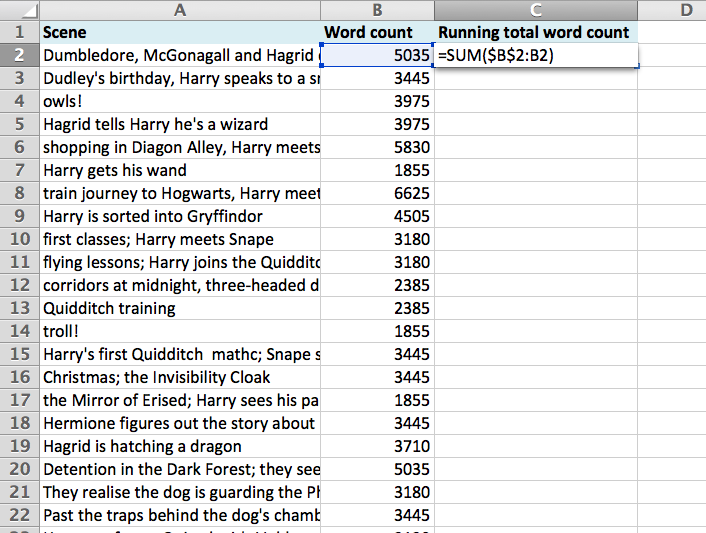
Now copy and paste the contents of cell C2 into all other cells in column C.
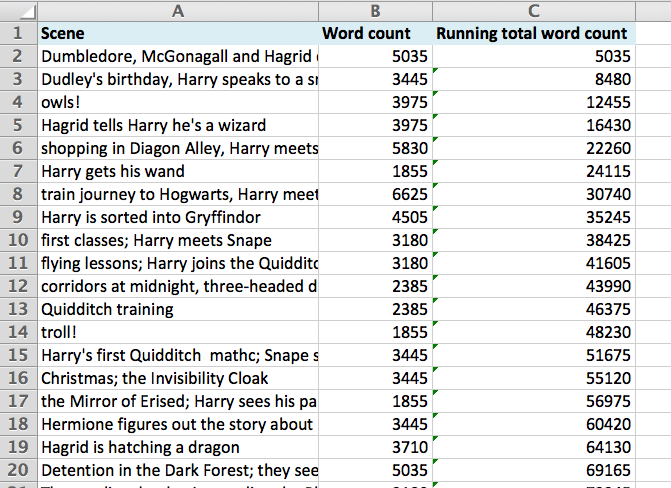
This formula works the same way in all major spreadsheet software (Excel, OpenOffice Calc, etc.).
Step 3: Quantify the intensity level of each scene
Add a fourth column to your spreadsheet. On a scale of 1 to 10, rate each scene's intensity level. Here are some questions you can use as guidance:
- Will this passage make the reader think Wow?
- How significantly does this scene impact the characters' lives or the plot?
- After this scene, can the characters easily return to the status quo of the previous scene?
- Is this an emotional turning point for one of the main characters?
- Is a major plot point revealed?
Remember that you're rating the scene intensity as the reader will experience it, not as you, as the writer, see it from your position of superior knowledge. For example, you could argue that Harry being sorted into Gryffindor (instead of Slytherin) is a huge turning point in his life. However, the reader had no idea of that when the first Harry Potter book was published.
Don't worry about the exact numbers. Just try to sketch out the relative importance of each scene. In any case, readers will each have their own interpretations of how intense each scene is, always differing somewhat from the writer's interpretation.
Step 4: Make a line chart
Now highlight columns C (word count running total) and D (intensity level). These are the two columns containing the data you'll use to create your chart.
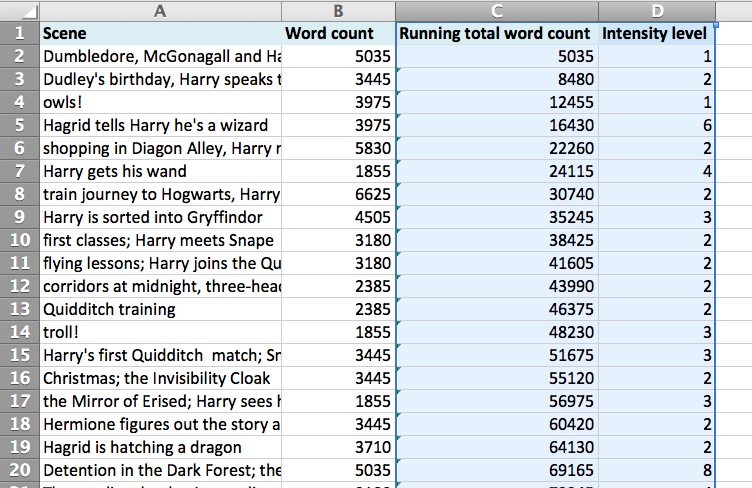
Excel: Insert » Chart » Scatter » Scatter with smooth lines
OpenOffice or LibreOffice: Insert » Chart » XY (scatter) » Points and lines
The trick here is to choose the 'scatter plot' option, and not the 'line plot'.
Step 5 (optional): Add labels to the plot
You can also add labels to your chart to identify key scenes. If you're using a particular plot template or structure (e.g. Hero's journey, three-act structure, etc.) you could also use the key points in that template as labels (inciting incident, midpoint, etc.).
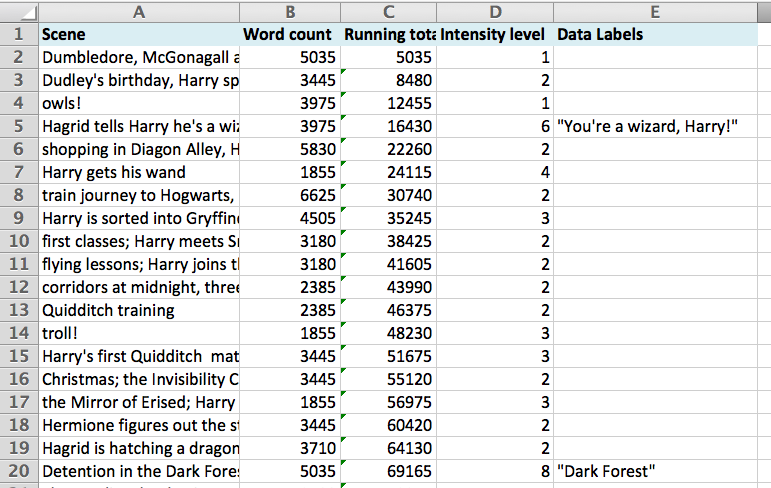
Excel: Right-click on any chart point, and select "Add Data Labels". Right-click on a point again, and select "Format Data Labels". In the pop-up window, deselect all the selected options ("X Value", "Y Value"...) and select "Value From Cells". Select the cell range containing your labels (in the screenshot, it's column E).
Note: Unfortunately, this will only work in Excel 2013 or later. It's not possible in OpenOffice or LibreOffice.
